
“In Defense of the SAT Adversity Score” – The Atlantic
“College Board’s new SAT ‘adversity score’ unfair to students” – USA Today
“The SAT’s New Adversity Score Misrepresents Reality” – Time
“Why Outrage Over the New SAT ‘Adversity Score’ Is Misplaced” – Forbes
As these headlines illustrate, there has been a recent media sensation about the addition of a new “adversity score” to the SAT. Critics claim that it “will hurt everyone involved… including those it purports to help,” (National Review) while supporters describe it as “a long overdue innovation.” (The Atlantic). Meanwhile, the college coaching industry is scrambling to figure out how to best adapt to this newest variable in college admissions—and charge parents handsomely for this extra service.
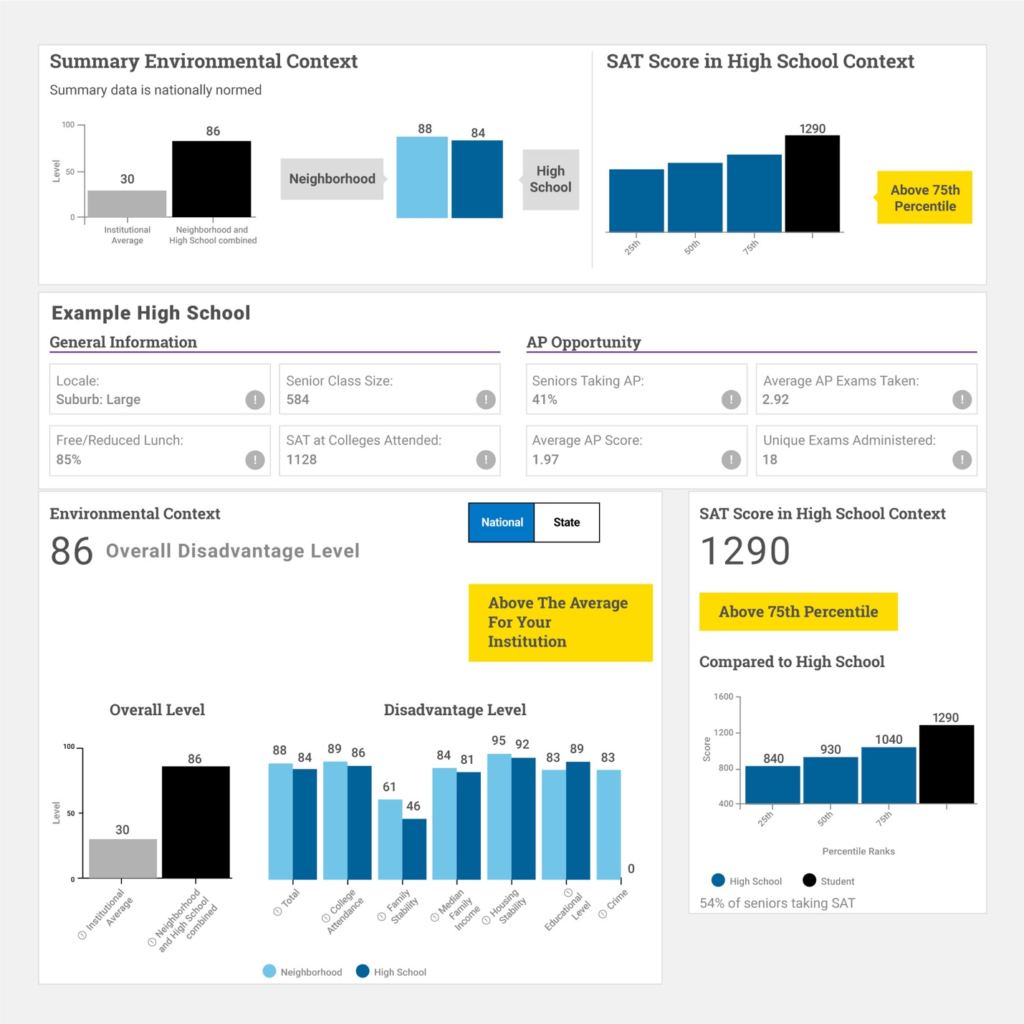
What exactly are these adversity scores which are generating such impassioned debate? Starting in the fall of 2019, the College Board is offering a free new tool to admissions departments at colleges and universities. Called the Environmental Context Dashboard, this tool presents each applicant’s SAT scores alongside a high-level summary of a large dataset of socioeconomic factors. That summary highlights three factors that the College Board calls “SAT scores in context… Information on the high school… [and] contextual data on the neighborhood and high school:”
1) SAT scores “in context:” This diagram shows the applicant’s SAT scores compared to the 25th percentile, 50th percentile, and 75th percentile of SAT scores from the applicant’s high school. In the sample diagram, this applicant received a 1290 on the SAT, which places him above the 75th percentile of students from his high school.
2) Information about the applicant’s high school: This dataset includes information about the financial circumstances of the average student plus a number of statistical measures of the AP exam performance of the average student at the applicant’s high school. However, the applicant’s own AP exam scores, if any, are not listed here.
In the sample diagram, the student’s high school is shown to be fairly large at 584 students in the graduating class. AP exams at this school are taken by only 41% of seniors with a shockingly low average score of 1.97. (AP exams are graded on a scale from one to five with one being the lowest possible score.)
3) Adversity scores, aka “Contextual data on the neighborhood and high school:” This infographic will no doubt prove to be the most controversial aspect of this new tool. It is compiled in the following manner: First, the College Board takes information from 31 different statistics about the average social and economic conditions of the geographic area in which the applicant lives. Then these statistics are combined using an unknown algorithm to produce a number ranging from one to one hundred. A score of one means that the applicant experienced the lowest possible amount of adversity and one hundred means that he experienced the highest. Our prospective student obtained a score of 86 for his “Overall Disadvantage Level.”
As astute readers may have noticed, race is not included anywhere in these datasets. In an article published May 17th of this year, The New York Times points out that the likely reason for this choice is that “many college officials are anticipating a potential Supreme Court ruling that could roll back the consideration of race in admissions.” The creation of these new adversity scores is therefore likely an attempt by the College Board, a for-profit organization, to get ahead of its main competition, the ACT, in case of such a Supreme Court ruling.
It is critical to note that all of these numbers represent averages of data concerning some three to eight thousand people who happen to live near the student. There is no individualized information in these scores at all.
Several potential problems with these scores are apparent. First, the only inputs to the calculation of adversity scores is information concerning averages of selected economic and social data from the geographic area in which the student lives. These statistics include average median family income, the poverty rate, percentage of households on food stamps, and so on. It is critical to note that all of these numbers represent averages of data concerning some three to eight thousand people who happen to live near the student. There is no individualized information in these scores at all, which is a serious issue given its presentation.
Second, these scores are presented by the College Board as rigorous and provable statements about the amount of adversity that a student has experienced in his academic career. However, there is no consideration of the actual circumstances of the individual. We may know that the neighborhood he was living in was poor or wealthy. But did his parents fit the mold of the people around them? No answer is given. Many students, this author included, struggled with severe medical problems throughout college. Of course, the College Board does not have access to such data, nor should it. Nevertheless, the College Board states in prominent bold letters that the “Overall Disadvantage Level” of a particular student is a 25 or a 30 or an 86, as if it could possibly boil down an incredibly limited data set with zero information about the individual to a single number.
Speaking of how the College Board produces these scores, how exactly does the College Board take its 31 different statistics and mix them all together to produce a single number representing a student’s adversity? We have no idea. As in zero. the presentation of the score is such that the College Board is strongly implying that it can and has provided mathematical rigor to a calculation that it does not possibly have the methodology or the proper input data to make.
Harvard gives a huge leg up in the admissions process to wealthy, privileged applicants from the “right” racial categories, while giving very little preference to poor students.
Despite these problems, the new adversity score will probably still do a better job than race-based admissions at granting the most disadvantaged among us an easier path into higher education. First of all, we must recognize that in modern America it is low income, not race, that is now most closely tied to lower academic achievement. As Stanford professor Sean Reardon noted in 2011, the “income achievement gap [in education] is now nearly twice as large as the black-white achievement gap.” This research would imply that the most disadvantaged group in American when it comes to education are poor people of any race.
Yet most colleges place a far
greater emphasis on race than wealth during the admissions process. Harvard itself acknowledged in the class
action lawsuit brought against it by Asian American families that Harvard’s
admissions preference for African-Americans is over twice the size of its
admissions preference for students of any race from families making less than
sixty thousand dollars a year. The
result of such policy is that, though Harvard considers only 32% of
African-Americans and Hispanics nationally
to be wealthy, 71% of the racial minorities actually admitted by Harvard are considered wealthy by those same standards.
In other words, Harvard gives a huge leg up in the admissions process to
wealthy, privileged applicants from the “right” racial categories, while giving
very little preference to poor students. By placing such a ridiculous emphasis on race alone
instead of income as the deciding factor in determining what applicants have
been the most disadvantaged educationally, Harvard ends up actually hurting,
rather than helping, poor students who have truly struggled with and overcome
the most challenges in their early educational career. This ludicrous behavior
is made even more offensive by the fact that average wealth in the United
States varies widely by race, so those most limited by Harvard’s current
policies are poor minority students. The new SAT adversity score is a seriously
flawed metric, but if it replaced the current heavy emphasis on race above all
else in college admissions, the admissions process would be better for it.
Be the first to comment on "The SAT Adversity Score: A Primer"